Charleston Housing Market: Another Gigantic Difference Between 2008 and 2018
Some are attempting to compare the current housing market to the market leading up to the “boom and bust” that we experienced a decade ago. They look at price appreciation and conclude that we are on a similar trajectory, speeding toward another housing crisis.
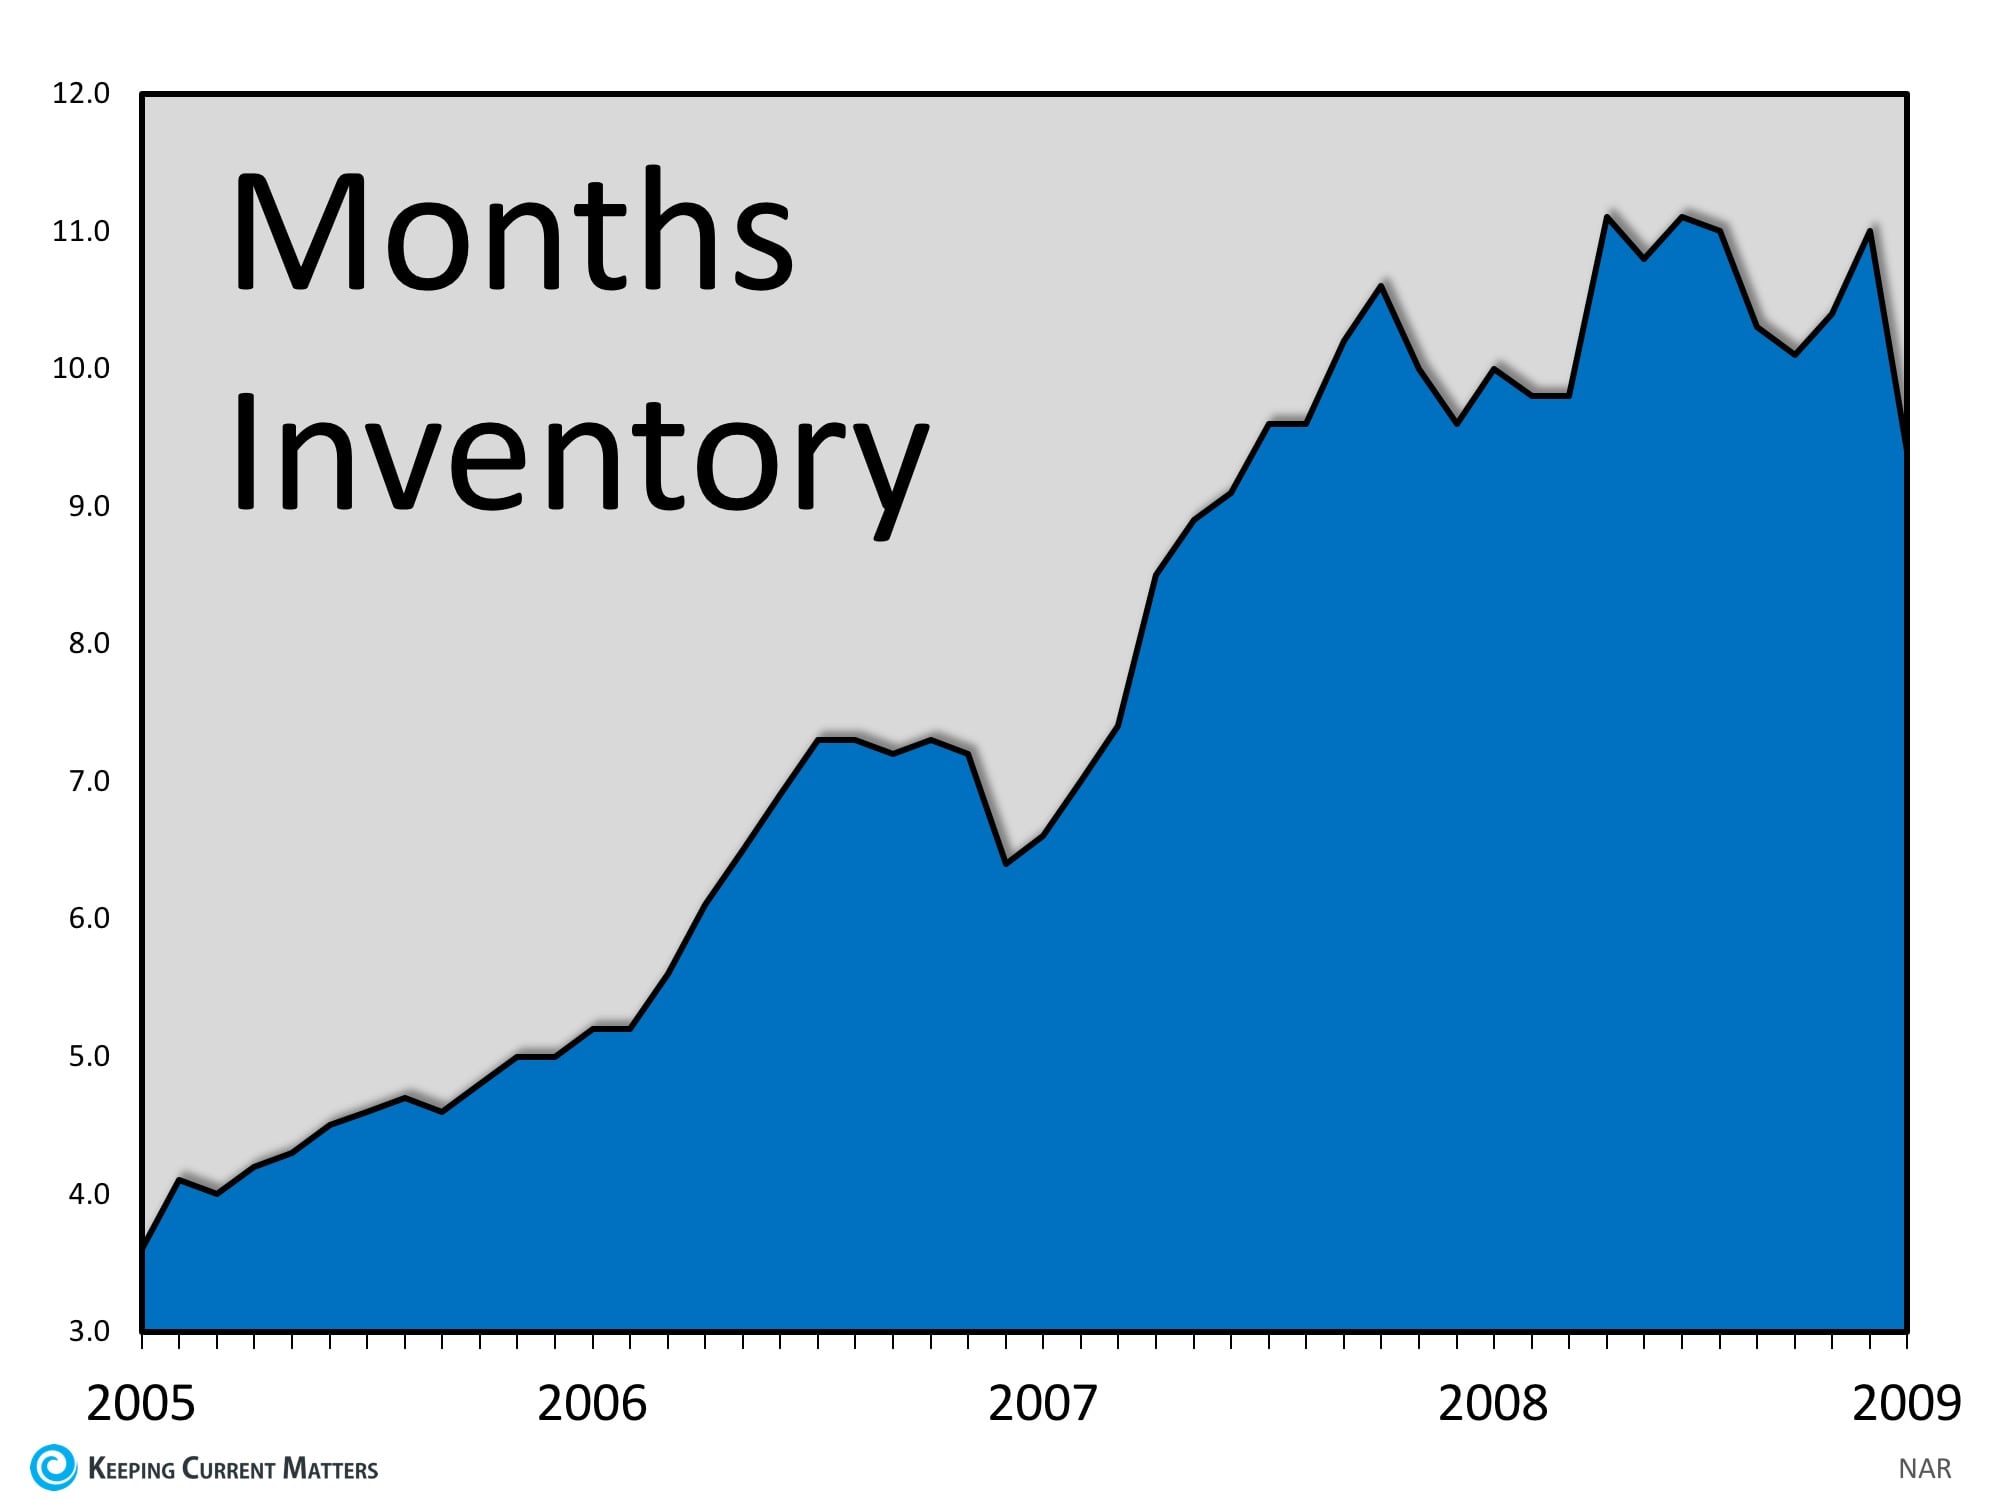
However, there is a major difference between the two markets. Last decade, while demand was being artificially created by extremely loose lending standards, a tremendous amount of inventory was coming to the market to satisfy that demand. Below is a graph of the inventory of homes available for sale leading up to the 2008 crash.

A normal Charleston market should have approximately 6 months supply of housing inventory. As we can see, that number jumped to over 11 months supply leading up to the housing crisis. When questionable mortgage practices ceased, and demand dried up, there was a glut of inventory on the market which caused prices to drop as there was too much supply and not enough demand.
Today is radically different!
There are those who believe that low mortgage rates have created an artificial demand in the current market. They fear that if mortgage rates continue to rise, some of the current demand will dry up (which is a possibility).
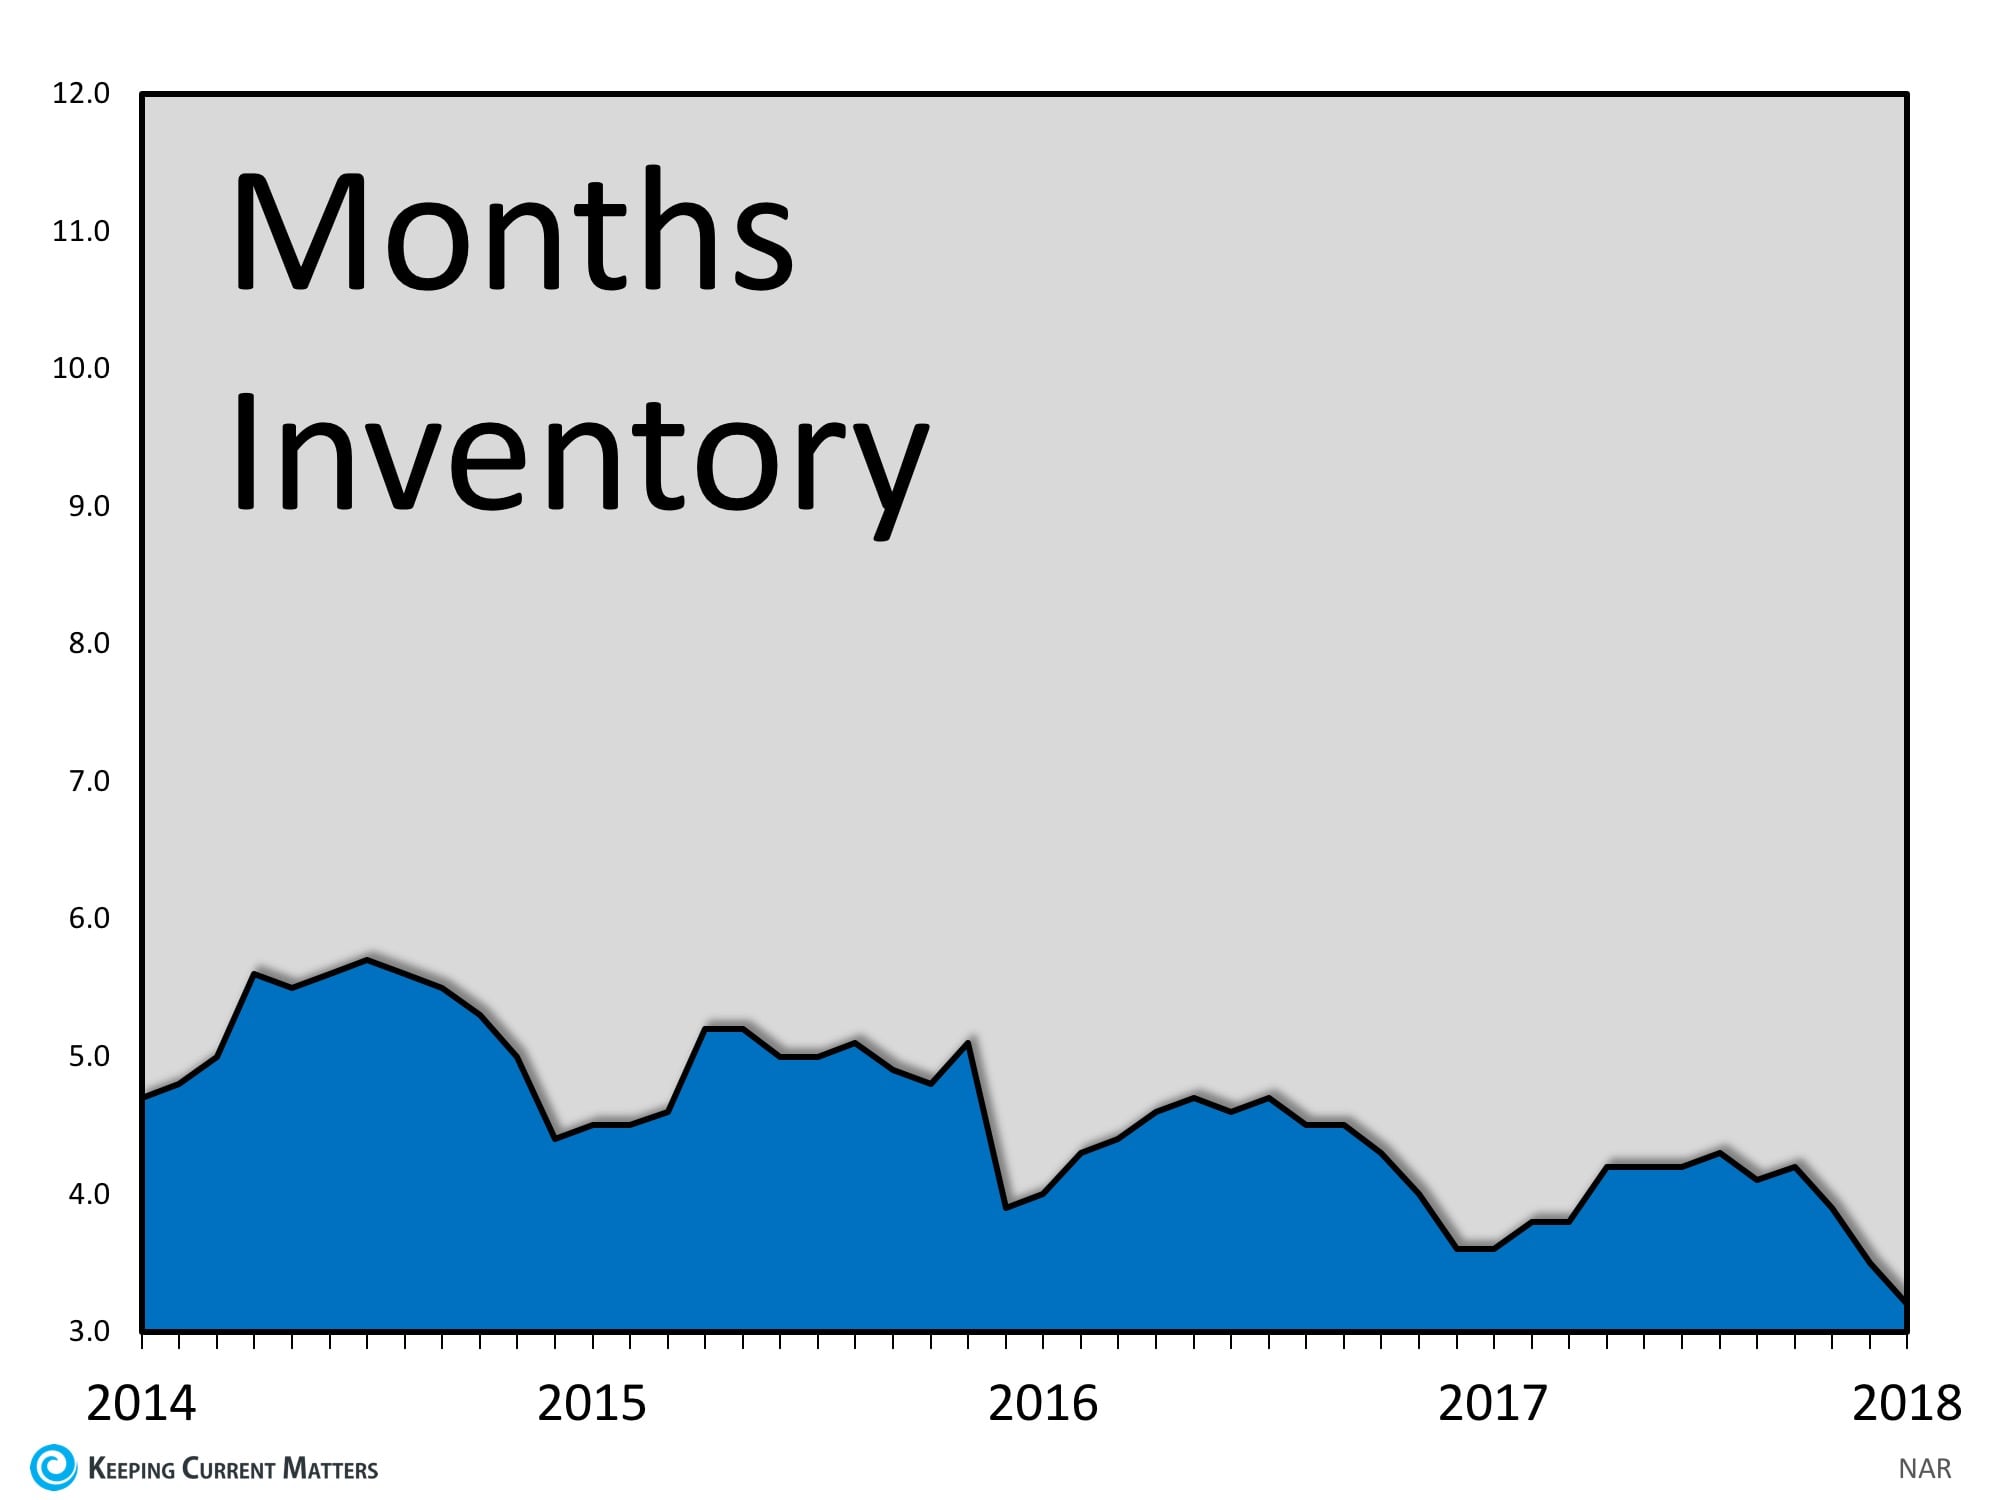
However, if we look at supply again, we can see that the current supply of homes is well below the norm of 6 months.

Bottom Line
We will not have a glut of inventory like we did back in 2008 and home values won’t come tumbling down. Instead, if demand weakens, we will return to a normal market (approximately a 6-month supply) with historic levels of appreciation (3.6% annually).
____________________________________________
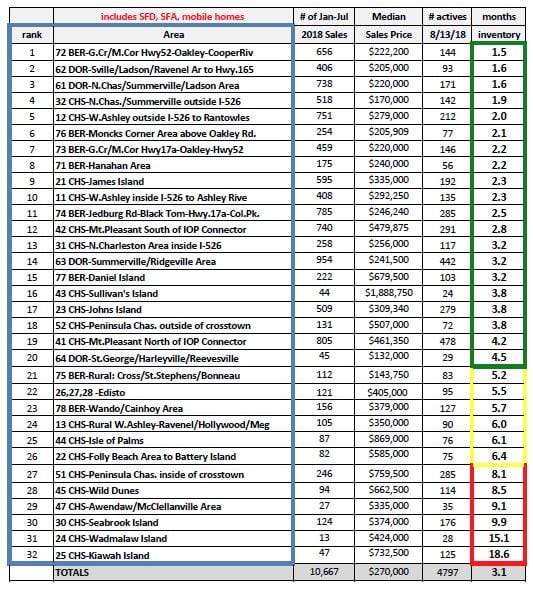
Here is a more in depth view of Charleston SC Real Estate inventory levels currently:
Months of Inventory 2018
This chart shows the relative strengths of the different MLS areas based on the number of sales during
Jan-July 2018 compared to the number of actives on 8/13/2018.
This ratio is of course directly related to the simple months of inventory number.
6 months of inventory is considered a healty, balanced market.
This chart includes single family detached, single family attached, and mobile homes.

